Google's Farmer/Panda Update: Analysis of Winners vs. Losers
The author's views are entirely their own (excluding the unlikely event of hypnosis) and may not always reflect the views of Moz.
By now, everyone in the SEO world is aware of the algorithmic update Google launched last Wednesday, February 23rd. Several posts on the topic are worth reading, including Danny Sullivan's take, Aaron Wall's assesment, SearchMetrics' analysis and Sistrix's data-driven post.
Here at SEOmoz, we've been analyzing the shift with help from our friends at Distilled, staff research scientist Dr. Matt Peters (whom you may remember from our Google Places analysis and who's now joined our staff full time - welcome!), and several other contributors. While there's no way to be precisely sure what Google changed to impact "11.8%" of queries, we've got some ideas that fit a number of the data points and we hope to contribute to the discussion on the topic and help search marketers gauge the update's impact on their own sites.
How to See the Farmer Update's Effect on Your Site(s) with Google Analytics
Step 1: Use GA's date comparison feature to see the same days before and after the update on Wednesday

Step 2: Exclude "branded" keyword traffic - you don't want those terms potentially gunking up the data, since they were very unlikely to be affected:

Step 3: Check out the traffic line comparison:

Step 4: Remove the comparison to see keyword counts, too (this data will also be in your web app traffic tab at the end of the week):

Step 5: Check out the week before, too:

Note some of the key filters applied - the exclusion of branded terms, the use of "non-paid" keywords only, and selection of "Google" as the engine (Bing didn't have an update). Using this process, you can check to see how your sites were (or weren't) affected. It appears that SEOmoz is virtually unaffected, as the past few weeks, our search traffic has been rising similarly to this pattern.
Who Lost in the Farmer Update?
Thanks to some datasets, we're able to get good data on the winners and losers.
First, there's Sistrix, which monitors 250,000 keywords in Google up to the first 100 ranking positions for each:
| # | Domain | Change | SISTRIX (before) | SISTRIX (after) | # KWs (before) | # KWs (after) |
|---|---|---|---|---|---|---|
| 1 | wisegeek.com | -77% | 121,58 | 28,22 | 74.024 | 21.940 |
| 2 | ezinearticles.com | -90% | 65,08 | 6,65 | 184.508 | 54.277 |
| 3 | suite101.com | -94% | 54,04 | 3,28 | 178.373 | 36.904 |
| 4 | hubpages.com | -87% | 55,16 | 7,40 | 152.998 | 50.178 |
| 5 | buzzle.com | -85% | 43,25 | 6,55 | 86.472 | 24.423 |
| 6 | associatedcontent.com | -93% | 38,29 | 2,57 | 216.429 | 53.512 |
| 7 | freedownloadscenter.com | -90% | 30,26 | 3,01 | 42.486 | 7.992 |
| 8 | essortment.com | -91% | 25,73 | 2,32 | 27.501 | 7.459 |
| 9 | fixya.com | -80% | 28,78 | 5,83 | 62.034 | 36.167 |
| 10 | americantowns.com | -91% | 24,88 | 2,18 | 26.000 | 9.799 |
| 11 | lovetoknow.com | -83% | 25,75 | 4,28 | 49.544 | 17.833 |
| 12 | articlesbase.com | -94% | 19,96 | 1,16 | 82.274 | 31.365 |
| 13 | howtodothings.com | -84% | 21,20 | 3,39 | 33.222 | 7.601 |
| 14 | mahalo.com | -84% | 20,49 | 3,23 | 33.875 | 9.740 |
| 15 | business.com | -93% | 17,24 | 1,13 | 21.556 | 4.813 |
| 16 | doityourself.com | -77% | 20,89 | 4,90 | 23.256 | 6.870 |
| 17 | merchantcircle.com | -85% | 18,43 | 2,67 | 93.347 | 34.681 |
| 18 | thefind.com | -83% | 18,95 | 3,27 | 74.506 | 45.495 |
| 19 | findarticles.com | -90% | 16,98 | 1,74 | 64.810 | 20.189 |
| 20 | faqs.org | -91% | 16,52 | 1,46 | 33.648 | 11.142 |
| 21 | tradekey.com | -89% | 16,83 | 1,79 | 37.364 | 16.268 |
| 22 | answerbag.com | -91% | 12,93 | 1,11 | 67.314 | 26.054 |
| 23 | trails.com | -87% | 12,05 | 1,62 | 38.346 | 8.511 |
| 24 | examiner.com | -79% | 10,54 | 2,19 | 70.781 | 31.272 |
| 25 | allbusiness.com | -88% | 8,86 | 1,08 | 16.457 | 6.034 |
_
Next is SearchMetrics, which monitors ~25 million keywords in Google:
| Domain | OPI_today | OPI_last | Difference | % |
| blippr.com | 11,024 | 529,970 | -518,946 | -97.9% |
| suite101.com | 19,874 | 263,529 | -243,655 | -92.5% |
| tradekey.com | 2,970 | 38,237 | -35,267 | -92.2% |
| associatedcontent.com | 23,687 | 281,343 | -257,656 | -91.6% |
| articlesbase.com | 13,492 | 157,958 | -144,466 | -91.5% |
| helium.com | 7,170 | 83,184 | -76,014 | -91.4% |
| faqs.org | 15,971 | 140,951 | -124,980 | -88.7% |
| freedownloadscenter.com | 23,216 | 192,128 | -168,912 | -87.9% |
| mahalo.com | 56,305 | 442,563 | -386,258 | -87.3% |
| allbusiness.com | 2,694 | 19,995 | -17,301 | -86.5% |
| ezinearticles.com | 35,691 | 259,516 | -223,825 | -86.2% |
| essortment.com | 13,507 | 93,993 | -80,486 | -85.6% |
| americantowns.com | 6,109 | 38,783 | -32,674 | -84.2% |
| findarticles.com | 11,648 | 70,404 | -58,756 | -83.5% |
| howtodothings.com | 10,605 | 62,372 | -51,767 | -83.0% |
| lovetoknow.com | 30,289 | 157,037 | -126,748 | -80.7% |
| hubpages.com | 122,796 | 618,406 | -495,610 | -80.1% |
| wisegeek.com | 113,436 | 489,014 | -375,578 | -76.8% |
| buzzle.com | 78,206 | 335,304 | -257,098 | -76.7% |
| doityourself.com | 8,069 | 33,231 | -25,162 | -75.7% |
| merchantcircle.com | 20,195 | 83,133 | -62,938 | -75.7% |
| business.com | 10,961 | 42,877 | -31,916 | -74.4% |
| thefind.com | 13,107 | 46,769 | -33,662 | -72.0% |
| trails.com | 9,607 | 32,385 | -22,778 | -70.3% |
As you can see, there's quite a bit of crossover between the two data sources on which sites have lost substantial traffic, and I suspect that both sources are at least correct that the sites listed have lost out in the update. Note that they both have unique ways of calculating a "visibility" score based on the rankings where a page/site appears, and these, along with the differences in which keywords they're monitoring, likely lead to imperfect overlap.
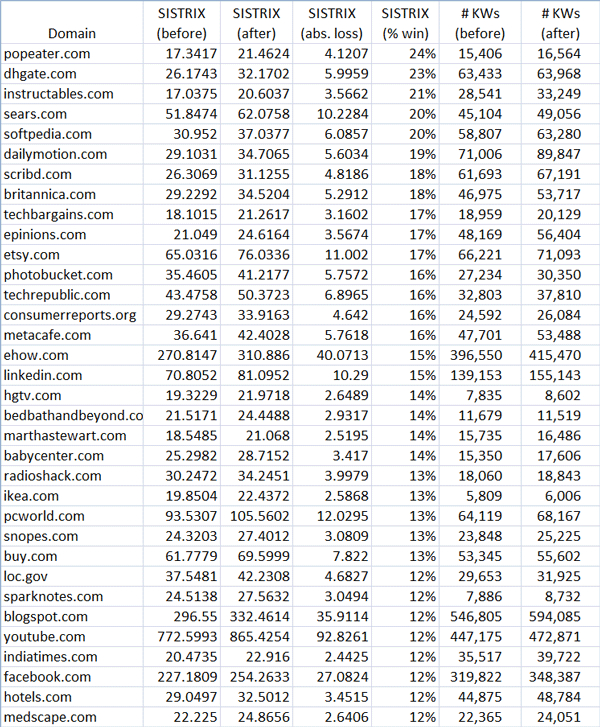
Who are the Winners in the Farmer Update?
Again, we've got some data from Sistrix:

And from SearchMetrics:
| Domain | OPI_today | OPI_last | Difference | % |
| wikihow.com | 455,031 | 254,087 | 200,944 | 79.1% |
| answers.yahoo.com | 524,056 | 406,523 | 117,533 | 28.9% |
| ehow.com | 944,950 | 831,961 | 112,989 | 13.6% |
| howstuffworks.com | 666,073 | 574,523 | 91,550 | 15.9% |
| huffingtonpost.com | 1,262,562 | 1,173,229 | 89,333 | 7.6% |
| facebook.com | 3,157,406 | 3,094,804 | 62,602 | 2.0% |
| instructables.com | 80,142 | 68,685 | 11,457 | 16.7% |
This data's a bit more curated from SearchMetrics (they appear to be excluding many winners - possibly clients?), and Wikihow is curious because it appears to have gained so strongly in their measurement, but doesn't appear on Sistrix's list.
Nonetheless, reviewing these winners and comparing them against the losers does suggest some potential causes, which we'll discuss more below.
Do Link Metrics Correlate with the Losers or Winners?
Before tackling other types of differences, we wanted to answer a question that Linkscape's web index is uniquely qualified to help handle - are links or link analysis responsible for Google's algorithmic shift?
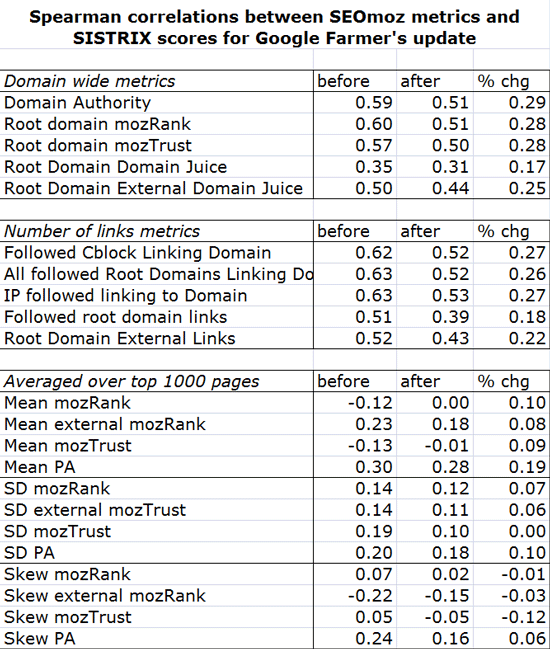
To answer that, we turned to the metrics available in the Linkscape API (most of which you'll see in the mozBar, Open Site Explorer and the Web App). Matt pulled data for each of the winners and losers from Sistrix's data (as we had that several days ago, but only today saw SearchMetrics' post). We then looked at Spearman's correlation coefficient for the winning vs. losing sites against various metrics.
The chart below compares the correlations with Linkscape metrics to Sistrix's visibility scores from before and after the update:

There's a few interesting takeways from this data:
- Generally speaking, link metrics on the domain level (Domain Authority, Domain mozRank, etc.) are very well correlated with Sistrix's visibility scores, which suggests that, broadly, links are (probably) quite important for large domains seeking to rank large quantities of content. That's nothing we didn't know, but it's a nice validation of both datasets and conforms to expectations.
- Prior to the Farmer Update, Linkscape's metrics were considerably better correlated with visibility scores, suggesting that link metrics are no longer as predictive of rankings/visibility as prior to the update (at least, for these sites).
- We generally interpret that to suggest that link analysis likely wasn't the culprit here - Google's Farmer Update is looking at something else on these sites - perhaps user/usage data, content analysis, page formatting, uniqueness/quality of user experience, etc.
- The bottom section of the chart is based on an intuition of Tom Critchlow's - that perhaps distribution of links to home vs. internal pages was a metric used in the Farmer Update. The data we collected, however, suggests (though doesn't prove) that's not the case.
Remember that correlation is not causation - this data leads us to believe link analysis isn't the culprit and certainly suggests that having good links correlates well with higher rankings/visibility, but there's always the possibility that other factors are at play. Those caveats aside, Tom, Matt and I all feel it's most likely that link analysis wasn't at work here and Google's using something else.
What Factors Could Have Caused Lost Rankings?
In reviewing the sites that got hit, we were struck by a few interesting, potential culprits.

_
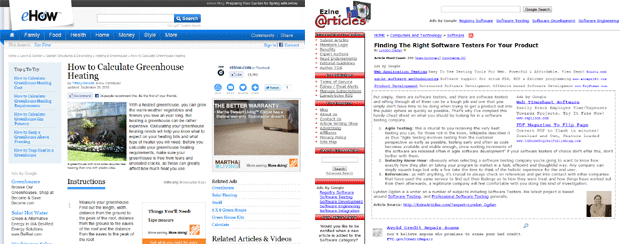
An eHow page on the left-hand side and an EzineArticles page on the right
- It seemed that sites whose pages had fewer and/or less intrusive blocks of advertisements on them tended to be in the winner bucket, while those with more and more intrusive advertising tended to be in the loser group.
- Likewise, sites whose UI/design would likely be described as more modern, high quality, thoughtful and "attractive" were winners vs. the "ugly" sites that tended to be in the loser bucket.
- When it came to user-generated-content (UGC) sites, those that tended to attract "thin" contributions (think EzineArticles, Hubpages or Buzzle) lost, while those with richer, often more authentic, non-paid, and not-intended to build SEO value or links (think Etsy, DailyMotion, LinkedIn, Facebook) won.
- In the "rich content" sector, pages with less usable/readable/easily-consumable content (think AllBusiness, FindArticles) tended to lose out to similarly content-rich sites that had made their work more usable (think LOC.gov, HuffingtonPost)
Based on these, we have some guesses about what signals Google may have used in this update:
- User/usage data - signals like click-through-rate, time-on-site, "success" of the search visit (based on other usage data)
- Quality raters - a machine-learning type algorithm could be applied to sites quality raters liked vs. didn't to build features/factors that would boost the "liked" sites and lower the "disliked" sites. This can be a dangerous way to build algorithms, though, because no human can really say why a site is ranking higher vs. lower or what the factors are - they might be derivatives of very weird datapoints rather than explainable mechanisms.
- Content analysis - topic modeling algorithms, those that calculate/score readability, uniqueness/robustness analysis and perhaps even visual "attractiveness" of content presentation could be used (or other signals that conform well to these).
More detailed analysis, particularly of individual pages that won vs. lost, may help to get more insight into these.
If you're an SEOmoz PRO member, there's a great discussion going on in the Q+A section and several sites have shared their week-over-week traffic graphs. While some patterns are emerging, there's conflicting signals on virtually everything, so we're not yet confident about solutions. That said, we'll be looking more deeply into this over the weeks to come, and hope to have more to report soon.


![How to Optimize for Google's Featured Snippets [Updated for 2024]](https://mza.bundledseo.com/images/blog/banners/599c98d541a541.28015161_2021-03-30-231401.jpg?w=580&h=196&auto=compress%2Cformat&fit=crop&dm=1617146041&s=bcfded4bdc1de1792b6efcfd16b9152f)
Comments
Please keep your comments TAGFEE by following the community etiquette
Comments are closed. Got a burning question? Head to our Q&A section to start a new conversation.