
How Do You Know If Your Data is Accurate? A case study using search volume, CTR, and rankings
The author's views are entirely their own (excluding the unlikely event of hypnosis) and may not always reflect the views of Moz.
Big Data and analytics has been called the "next big thing," and it can certainly make a strong case with the explosion of easily accessible, high-quality data available today. In the inbound marketing world, we have access to backlinks and anchor text, traffic and click stream data, search volume and click through rate (CTR), social media metrics, and many more. There is huge value in this data, if we can unlock it.
But, there's a problem: real world data is messy, and processing it can be tricky. How do we know if our data is accurate, or if we can trust our final conclusions? If we want to use this data to find a better way to do marketing, we have to be careful about accuracy.

There are no hard and fast rules when it comes to data analysis. There are some best practices, but even these can get a little murky. The most important thing to do is to put on your detective cap and dive into the data. The more familiar you are with the data, the easier it is to spot something that seems strange. More than likely, your findings will be quality issues that need to be improved.
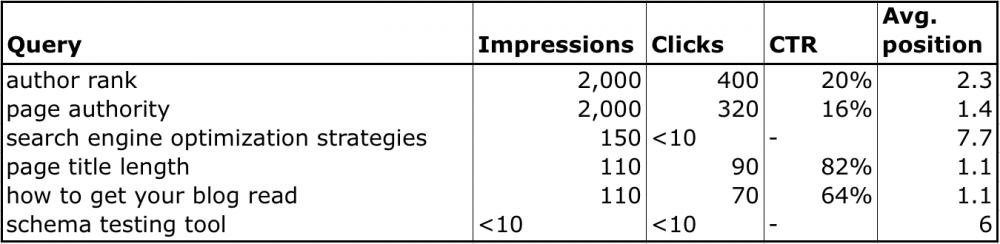
Throughout this post, we will use a data set from Google Webmaster Tools of keyword search referrals as a case study. Here's a snippet of the data:
We also put all of our keyword analysis code on Github so you can run our analysis on your own site's data.
The rest of this post discusses six best practices and suggestions for ensuring your data and results are accurate. Enjoy!
1. Separate data from analysis, and make analysis repeatable
It is best practice to separate the data and the process that analyzes the data. This also makes it possible to repeat the analysis on different data, either by you or by someone else. For this reason, most data scientists don't use Excel since it couples the data with analysis and makes it difficult to repeat. Instead, they often use a high-level statistical oriented scripting language, like R, Matlab/Octave, SAS, or a general-purpose language like Python.
At Moz, the data science team uses Python. Our Big Data team also uses it heavily, which makes it easy to integrate our algorithms with their production code.
2. If possible, check your data against another source
In many cases this step may be impossible, but if you can, it's the best way to make sure you data is accurate. In Moz's case, we were able to check the Google Webmaster Tools data against data from Google Analytics.
Some pieces to focus on when you're comparing data include total aggregate counts, counts in sub-categories, or averages. In our case, we checked both the total search visits and spot check the number of visits for a few different keywords.
3. Get down and dirty with the data
This is the fun part where we get to play with the data and do some exploratory data analysis. A good place to start is by looking at the raw data to see what jumps out. In the case of the Google Webmaster Tools data, I noticed that they don't always give the search volume in long-tail cases with only a few searches. Instead, the data has "<10" or "-" instead of numbers that will need to be handled carefully since they will result in missing values.
This is also the time to put on your detective cap and start asking questions about the data. We looked at some keywords like "seomoz" and "page authority" that are branded, and some like "author rank" and "schema testing tool" that are not. After checking out the data, I asked myself, "Hmmm, I wonder if there is any difference in Click through rate between branded and non-branded keywords, or in average search position?"
Usually by this point I'm amped to start answering hard questions, but I try to resist the temptation to jump off the deep end until I run a few more sanity checks. Univariate analysis is a great tool to help you check yourself before going too far, especially since most software packages provide an easy way to do it and it often produces the first interesting results. The idea is to get a picture of what each variable "looks like" by plotting a histogram and calculating things like the mean.
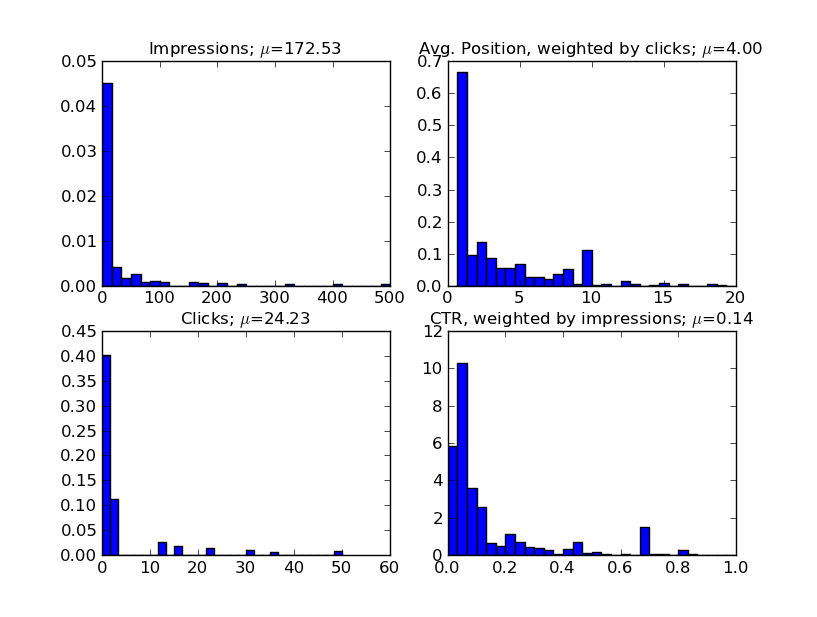
The above chart shows an example of univariate analysis on our data. In each panel, we have plotted the distribution of one of the four variables in our data: Impressions, Average Position, Clicks, and CTR. We also included the mean of each distribution in the title. Immediately, we can see a few interesting comparisons.
First, almost all of our keywords are "long-tail" with less then 100 searches/month. However, much of our traffic is also made up from a few high-volume keywords (>1000 searches/month). The average position is concentrated in the top 10 as expected (since results off the first page send very little traffic). This is also good check of our data. If we had seen a significant amount of keywords sending traffic at ranks lower then #10, we should investigate further. Finally, the CTR in the lower right is interesting. Most of the keywords have CTR less then 40%, but we do have a few high volume keywords with much higher CTR.
By now, I usually feel pretty comfortable with the data and can jump in. At this point, I've found that asking specific questions is often the most productive way to answer bigger questions, but everyone works differently, so you'll need to find what works best for you. In the case of the Google Webmaster Tools data, I'm curious about the impact of branded vs non-branded keywords.
One way to examine this is to segment the data and then repeat the univariate analysis for each segment. Here's the plot for impressions:
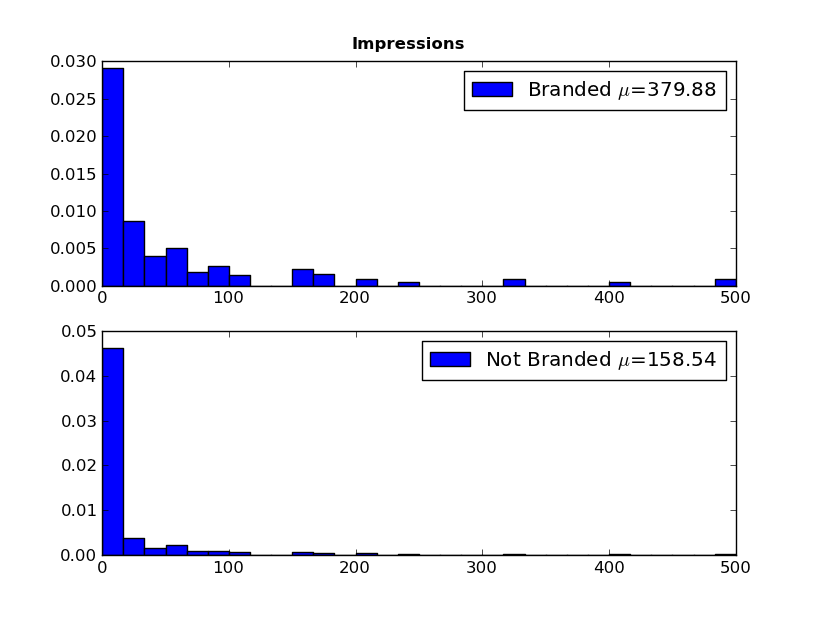
We can see that, overall, branded keywords have a higher search volume then non-branded words (means of 380 and 160, respectively). It gets more interesting if we look at average position and CTR:
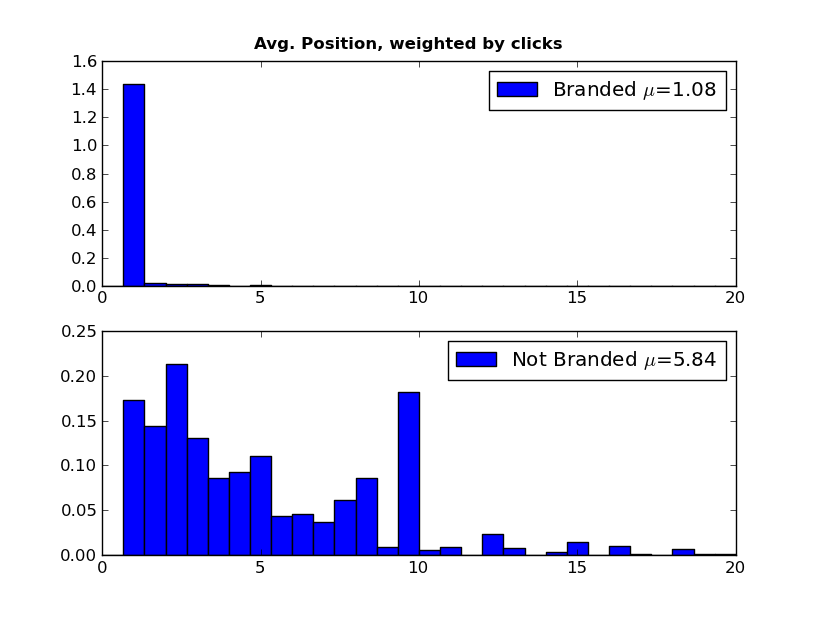
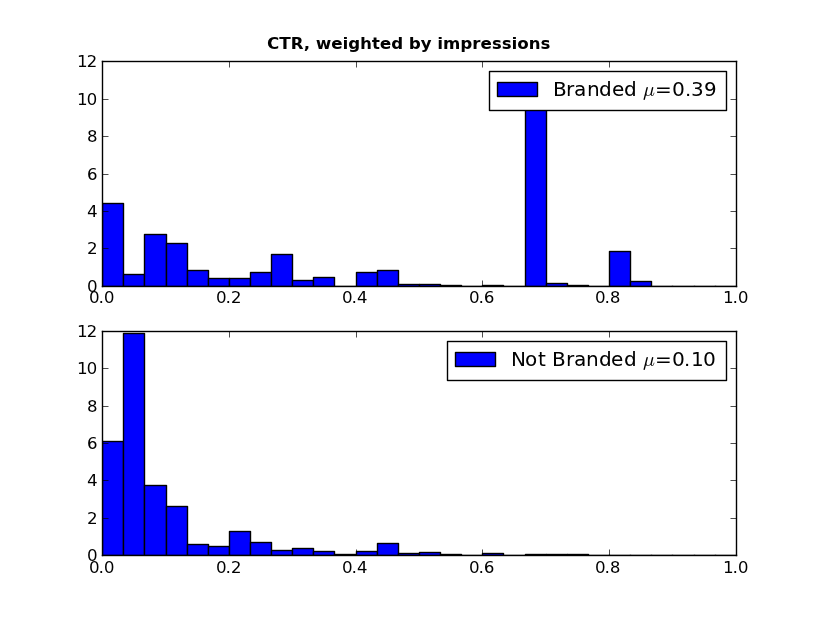
We see a huge difference in Average Position and CTR between the branded and non-branded words. Most of our traffic from branded words is in the top two or three positions, with non-branded queries sending traffic throughout the top 10. The CTR is also significantly different with a few branded keywords having very high CTR (60%+).
We might also wonder about how the CTR changes with the search position. We expect that lower-ranking keywords will have a lower CTR. Can we see this in the data?
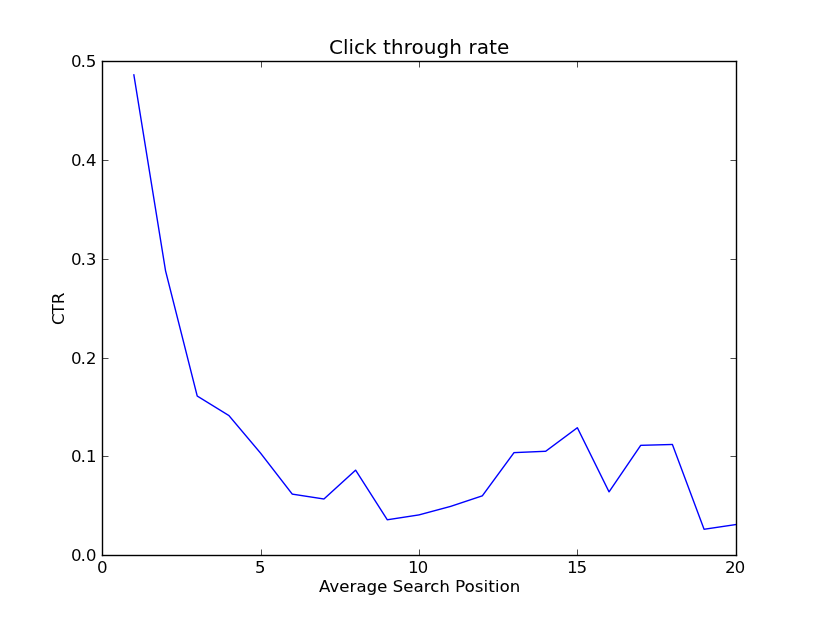
Indeed, the CTR drops off rapidly after the top five. There is an interesting bump up at position 15, but this is a data sparse region so this may not be a real signal.
4. Unit test your code (where it makes sense)
This is a software development best practice, but can get a little sticky in the data science world and often requires judgement on your part. Unit testing everything is a great way to catch many problems, but it will really slow you down. It's a good idea to use unit test code that you think will be used again, has a general purpose outside the specific project, or has complicated enough logic that it would be easy to get wrong. It's often not worthwhile to test code quickly written to check an idea.
In the case of the Google Webmaster Tools data, we decided to test the process that reads the data and fills missing values because the logic is somewhat complicated, but didn't test our code to generate the plots since it was relatively simple. We used a small, synthetic data set to write the tests since it is easy to manage. Check out some of our tests here.
5. Document your process
This step can be annoying, but you will thank yourself a few months later when you need to revisit it. Documentation also communicates your thoughts to others who can check and validate your logic.
In our case, this blog post documents our process, and we provide some additional documentation in the README in the code.
6. Get feedback from others
Peer review is one of the cornerstones of the academic world, and other people's insight is almost always beneficial to improving your analysis. Don't hesitate to ask your team for feedback; most of the time, they'll be happy to give it!
Do you have any other helpful testing tips? What has worked for you and your team? I'd love to hear your thoughts in the comments below!


Comments
Please keep your comments TAGFEE by following the community etiquette
Comments are closed. Got a burning question? Head to our Q&A section to start a new conversation.