Raising the Bar on Data Sharing: Introducing Open Analytics
The author's views are entirely their own (excluding the unlikely event of hypnosis) and may not always reflect the views of Moz.
On the Internet, there is one thing that is as reliable as the gold in Fort Knox: a website's analytics. How many times have you read a great blog post with amazing infographics or just a post that was very well written and wondered how much traffic that site has received from it? At SEOmoz we strive to be transparent about everything we do, but even our traffic data is something that we don't often share.
Today we're introducing Open Analytics, a new feature on our blog and YOUmoz sections that allows you to see traffic data for individual blog posts. To view the analytics data, just click the "Post Analytics" button at the bottom of any blog post.

Traffic stats from Facebook + Twitter's Influence on Google's Search Rankings
For each blog post you will get six different stats from the time the post was published to the date you request the stats:
- Number of visits the post has received
- Number of pageviews for the post
- Average amount of time our visitors spend on each page
- The next three stats are traffic source data: direct traffic, search traffic, and referral traffic
Why We Did It
Transparency
SEOmoz has a strong set of core values that are outlined in our TAGFEE Tenets. (You can read more about them in a post by Rand titled What We Believe and Why: SEOmoz's TAGFEE Tenets.) Since TRANSPARENCY is the first tenet, we wanted to share with you which blog posts are successful and which didn't do so well.
Education
The SEOmoz community is here to learn, and by seeing the traffic stats for each post, we can learn a great deal about the post's topic and content. Do the most successful posts contain more data, graphics, or both (infographics)? Which topics go the most viral (Referral Traffic)? Approximately how many times does one visitor revisit a post, on average (Pageviews divided by Visits)?
Belief in Inbound Marketing
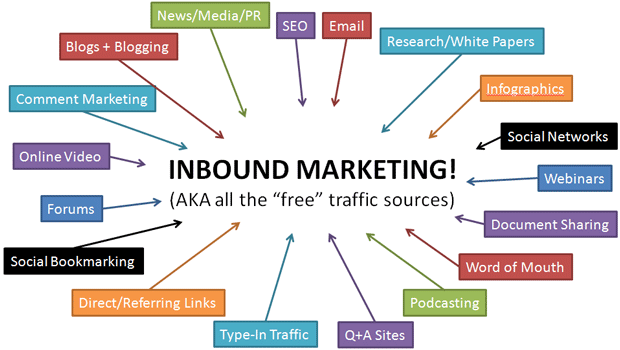
We strongly believe in the power of Inbound Marketing and want to invest in those channels! We want to walk the walk by allowing you to see the traffic stats of a business that not only believes in Inbound Marketing but is actively doing it.

Expose Content That Works
Does having a video in your blog post increase the amount of visits and time on page compared with a post that only has text? You now have access to our analytics data to help you decided what works and what doesn't. Back when I originally wrote my post What Makes a Link Worthy Post - Part 1 and Part 2, I didn't have access to this data. Imagine what you can do with the data now.
Expose Bloggers To Data They Want
Many of our YOUmoz writers want to know how their posts did other than looking at the number of thumbs or comments they have gotten from our users. Now, after your post is published, you can see the true amount of traffic that your post was exposed to. Plus, let's be honest: it's fun to brag to your friends about how your post did better than theirs.
How We Did It
We use the Google Analytics API to pull post data into our CMS, cakePHP. For those of you who have used the Google Analytics API before, you know that it can be slow to return information and the information can have a delay to it. To reduce the amount of time our community members had to wait to see our data, we converted the data from Google Analytics API into a JSON string. This JSON string is stored on our server and refreshed at a interval based on the age of the post. Newer posts get fresh updates every hour and older posts get fresh data every four hours.
For those who are interested in more information on how we executed Open Analytics, please feel free to let me know in the comments and I can go more into depth on a future blog post.
Future Expansion
Since this is the first release, we want to hear from you on what you would like to see. Ideas that we have floated around included showing keywords that are driving traffic to the post, top referrers that send traffic, and showing historical traffic charts. Before we move forward we want to hear from you on what you would like to see. Don't be shy - we want to share information with you.


Comments
Please keep your comments TAGFEE by following the community etiquette
Comments are closed. Got a burning question? Head to our Q&A section to start a new conversation.